

LLM Observability: Tutorial & Best Practices
Modern LLM applications consist of multiple technology layers, starting from the user input processing to final response generation. These layers contain components that can hallucinate, have high latency, and high token usage. They can incur significant costs and leak sensitive data if your team cannot identify the source of the issue.
LLM observability includes the technologies and processes that increase visibility into the inner workings of your LLM application layers. They help you determine the root cause of incidents, which you can then fix to improve the performance, quality, and robustness of your LLM application.
This article walks you through the foundations of LLM observability, including common observability tools and best practices. We also include a hands-on example of implementing LLM observability in a RAG-based and tool-calling application.
Summary of key LLM observability concepts
What is LLM observability?
Definition: LLM observability is the practice of gathering data (telemetry) while an LLM-powered system is running to analyze, assess, and enhance its performance.
At its core, LLM observability is about making the inner workings and outputs of LLM-powered applications visible and measurable. In practice, this means instrumenting your application to capture everything from prompts and responses to latency, errors, and feedback signals.
LLM observability is crucial because LLMs often behave as black boxes with non-deterministic outputs, which makes it hard to anticipate issues without deep visibility into their runtime behavior.
{{banner-large-dark-2="/banners"}}
LLM observability vs. traditional application monitoring
Traditional application monitoring focuses on infrastructure-related metrics and predetermined health checks (CPU, memory, request rates, error codes, etc.). In contrast, LLM observability deals with the dynamic, content-rich interactions between users and the model.
For example, a traditional monitoring application might tell you that an API endpoint is slow or returns a 500 error. In contrast, LLM observability tells you:
- Which prompt caused a faulty answer
- How the model arrived at that answer (through intermediate steps or retrieved context)
- How often do such problematic outputs occur?
It's also important to note that LLM observability is broader than just real-time monitoring. While real-time checks may catch latency spikes or blocked responses, observability includes long-term evaluations of quality, hallucinations, security risks, and debugging through trace logs and evaluation metrics.
The following table highlights the key differences between traditional application monitoring and LLM observability.
In summary, LLM observability builds upon traditional monitoring by capturing rich, domain-specific data (such as prompts, outputs, and token counts) and by incorporating quality and safety analysis of the AI’s behavior.
Why observability is critical for LLM applications
Observability helps engineers overcome the following challenges while developing and testing LLM applications.
Unpredictability and non-determinism
LLMs can produce different responses for the same prompt, making them highly unpredictable and non-deterministic. Minor changes to an input can considerably change the output during different runs. Therefore, prechecking all possible model behavior is impossible. The only way to identify and remove these emergent behaviors is through continuous observability.
Incorrect outputs and hallucinations
LLMs often hallucinate, confidently presenting wrong information as the right one. For example, they usually generate made-up references when a student asks them to write a paper. Simple error logging is insufficient to catch hallucinations, as they often sound believable. You need LLM observability to detect incorrect answers.
Latency challenges and performance
LLM applications consume a lot of resources. Response times vary significantly because some applications utilize external APIs. Latency also increases in cases where applications chain retrieval operations or model calls. Observability identifies bottlenecks in various layers of an LLM pipeline, allowing you to address them and reduce application latency.
Debugging difficulty and prompt sensitivity
LLM applications rely on agent tools or chains incorporating multiple-step input sequences or complex prompt patterns. Therefore, the output varies significantly even if the wording changes slightly. To trace the problem, you need to log the prompts, intermediate steps, and the model’s final decision extensively. LLM observability underscores and records invisible logic to enhance the transparency of the black box.
Cost monitoring and optimization
Calling large models, especially via paid APIs, incurs significant costs. For instance, each prompt and response token with GPT-4 has a price. These costs can add up quickly in production. Unexpected usage, such as a longer-than-usual prompt, can quickly blow budgets. Observability addresses this by tracking token usage and cost per request in detail.
Integration of tools and RAG Systems
LLM applications often incorporate external data sources and tools. For example, Retrieval-Augmented Generation (RAG), where the app first fetches relevant documents from a vector database, and then the LLM uses them to answer the query. If the end answer is of low quality, the cause might be the LLM itself or the retrieval component returning irrelevant context. Without observability, it’s hard to tell.
A specialized observability tool detects that the documents retrieved had low semantic similarity to the query, leading to a likely hallucination.
Security and compliance risk
Because LLM outputs are free-form text, there’s a risk of sensitive information being leaked or policies being broken. For example, an LLM might expose private data from its context window or be tricked via prompt injection to reveal system prompts or confidential instructions. Observability is crucial for detecting these incidents.
In summary, the black-box nature, open-ended inputs, and novel failure modes of LLMs make observability indispensable. It’s not just about fixing bugs faster; it’s about ensuring the AI system remains trustworthy, efficient, and safe over time.
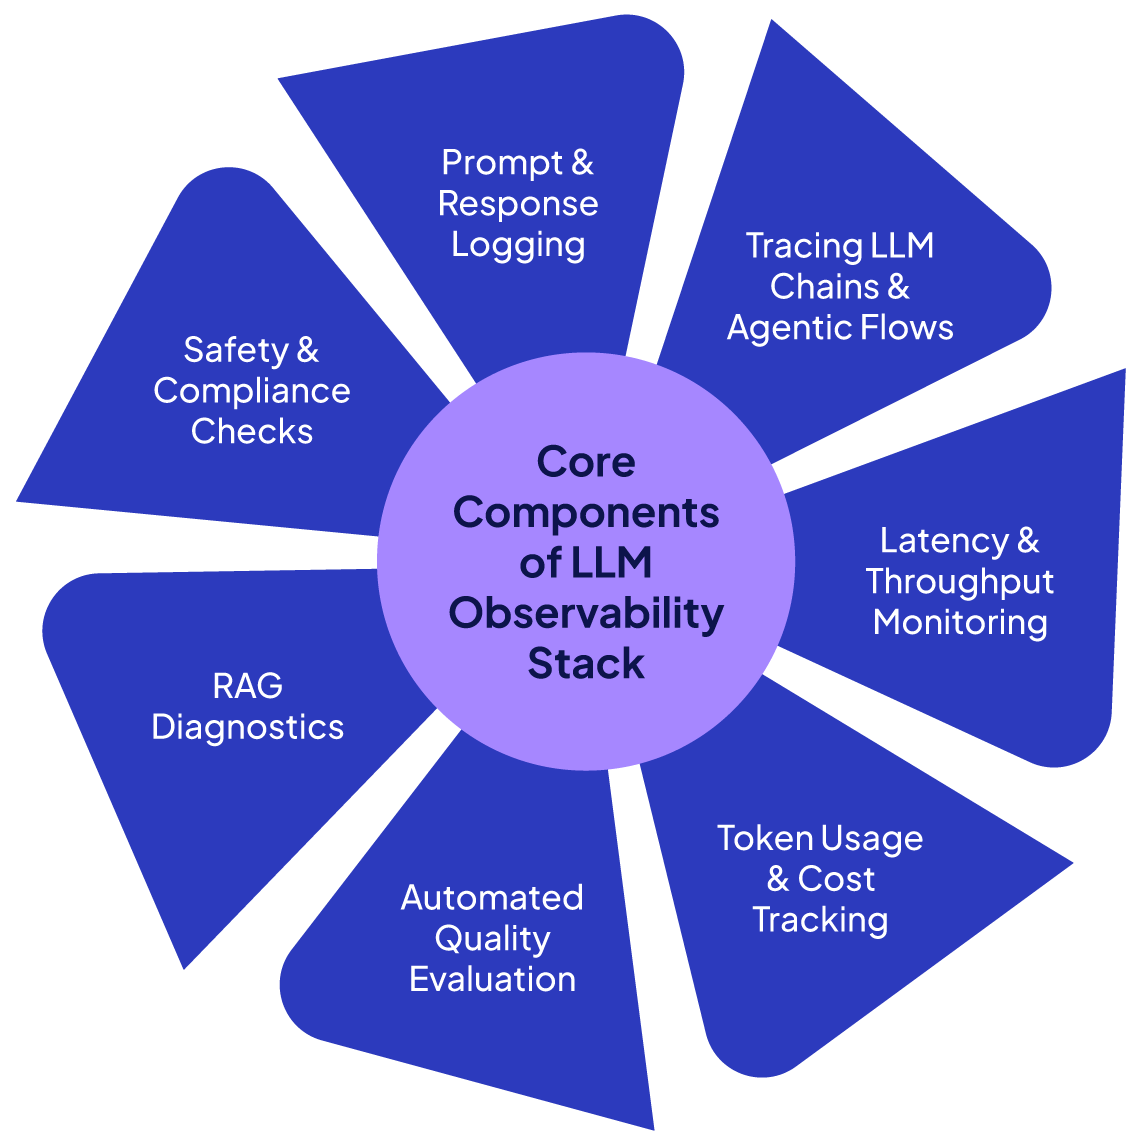
Core components of an LLM observability stack
An effective LLM observability stack comprises several key components and best practices. Here we detail each of these core elements and how they work together.
Prompt and response logging
The fundamental feature of any LLM observability system is to capture and log all prompt-response pairs in an application. It enables engineers to learn how changes in the prompt affect model response, analyze patterns across requests, and debug unexpected errors and model behaviors. For example, if a user reports a poor response from an application, logging can help identify the prompt and the context around it that yielded the response.
Tracing of LLM chains and agentic flows
Tracing is essential when an LLM application involves multiple prompts and responses. It consists of building a timeline of all the steps of a user request from the initial prompt to the final application output. For example, in the context of LLM, a trace might include:
- The user’s initial query
- When the application retrieves knowledge (RAG)
- When the LLM is passed the query, and the retrieved knowledge
- When any guardrails are implemented to filter or format the final response, etc.
These multi-step AI timelines are an integral part of the LLM observability stack.
Latency and throughput monitoring
Just like traditional monitoring, LLM observability also tracks system load, throughput, and latency for performance evaluation. However, it includes granular details. LLM observability tools record latency for each model’s invocation as well as overall latency for a user request. Using this information, you can identify the component of your LLM application that creates a bottleneck and high latency.
Similarly, throughput monitoring is crucial for scaling your application, as it indicates the number of requests being served and whether you’re approaching rate limits or capacity constraints. Most LLM observability applications log these metrics.
Token usage and cost tracking
Observability systems often integrate token usage and cost-tracking systems that alert administrators if a prompt is too lengthy or if token usage exceeds a certain threshold.
Token usage refers to the number of tokens (a unit of text used by LLM) sent in the prompt and generated in the output by a model. Token usage depends on the user’s initial query, the system prompt, and the context retrieved in applications such as RAG, etc.
Tracking the number of tokens is crucial since most API providers charge based on the number of tokens consumed. It also helps you identify the type of requests, users, and sessions that consume the most tokens and result in higher costs. With this information, you can apply prompt shortening techniques or use cheaper models for lengthy inputs.
Automated quality evaluation
Automatic output quality evaluation is a key feature of LLM observability. It employs several techniques to attain this goal, including:
- LLM-based evaluators that detect a specific error, such as an incorrect or misguided answer.
- Heuristic checks and rules, such as a response should include specific keywords related to the prompt.
- Comparisons to ground truth, i.e., comparing the LLM’s answer with expected answers or metrics like the BLEU score or accuracy.
- User feedback, such as reviews.
Retrieval (RAG) diagnostics
LLM observability applied to Retrieval Augmented Generation (RAG) involves tracing and logging all the components of the RAG application pipeline. For example, LLM observability logs the result of a similarity search between a user query and the documents returned by a vector store. If the retrieved context doesn't conform to the user query, the LLM response will likely be wrong. Observability also logs whether the response returned by a RAG system is grounded in the retrieved context or if an LLM is hallucinating.
By including RAG in observability, you ensure that when the LLM gives a poor answer, you can diagnose whether it didn’t have the information (retriever issue) or it misused the data it had (LLM issue).
Safety and compliance checks
Observability tools should flag biased or toxic responses. An LLM must also not leak Personally Identifiable Information (PII) or sensitive information. Observability tools enable the integration of regex-based or machine learning-based scanners to detect such outputs. Finally, LLM observability must be able to detect prompt injections and prevent jailbreaking.
{{banner-large-dark-2="/banners"}}
LLM observability tools and platforms
Several observability platforms have emerged to support the specific needs of LLM-based applications. The following table compares them.
How Patronus AI helps in LLM observability
Patronus AI offers end-to-end LLM observability features ranging from point-in-time agent observability to full trace application observability.
Point-in-time agent observability
For point-in-time agent output observability, Patronus evaluators enable hallucination and prompt injection detection, answer and context evaluation, faithfulness detection, harmful output filtering, and various other tasks. These evaluators use state-of-the-art Lynx, Glider, and other judge LLMs for these tasks.
Let’s see an example where we will use Patronus’s Glider model to detect whether the response from a RAG application is faithful to the context retrieved during the retrieval step.
Note: The codes for this section are available in this Google Colab notebook.
Run the following script to install the required libraries:
!pip install -qU langchain-community
!pip install -qU langchain-openai
!pip install -qU langchain-text-splitters
!pip install -qU langgraph
!pip install -qU langchain-core
!pip install -qU pypdf
!pip install -qU chromadb
!pip install -qU patronus
You will also need the Patronus and OpenAI API keys:
from google.colab import userdata
OPENAI_API_KEY  = userdata.get('OPENAI_API_KEY')
PATRONUS_API_KEY = userdata.get('PATRONUS_API_KEY')
The following script imports the required modules and libraries:
from langchain_community.document_loaders import PyPDFLoader
from langchain_text_splitters import RecursiveCharacterTextSplitter
from langchain_openai import OpenAIEmbeddings
from langchain_community.vectorstores import Chroma
import os, patronus
from IPython.display import Image, display

from langgraph.graph import StateGraph, START, END   # keep the official END
from langchain import hub
from langchain_openai import ChatOpenAI
from typing_extensions import TypedDict, List
from langchain_core.documents import Document
from patronus.evals import RemoteEvaluator


patronus.init(api_key=PATRONUS_API_KEY)
Next, store a PDF document containing the WHO report on the latest COVID updates in a vector database.
## https://www.who.int/publications/m/item/covid-19-epidemiological-update-edition-177

pdf_url  = "/content/ceu_177.pdf"
docs     = PyPDFLoader(pdf_url).load()

embeddings = OpenAIEmbeddings(api_key = OPENAI_API_KEY)

splits   = RecursiveCharacterTextSplitter(chunk_size=1000,
                                          chunk_overlap=200,
                                          add_start_index=True).split_documents(docs)

vs        = Chroma.from_documents(splits,
                                  embeddings)
The following script demonstrates how to create RAG applications with LangGraph that use Patronus’s Glider model to detect whether the output reflects what's in the retrieved context.
**Note:** We send a dummy answer to the output instead of the original answer, as we want to see how the Glider model identifies the incorrect answer and provides explanations.
prompt = hub.pull("rlm/rag-prompt")
llm = ChatOpenAI(model="gpt-4o",
api_key = OPENAI_API_KEY)
class RAGState(TypedDict):
question: str
context: List[Document]
answer: str
verdict: str # PASS / FAIL from Glider
reasoning: str # textual explanation
def retrieve(s: RAGState):
docs = vs.similarity_search(s["question"], k=2)
return {"context": docs}
def generate(s: RAGState):
ctx = "\n\n".join(d.page_content for d in s["context"])
msgs = prompt.invoke({"question": s["question"], "context": ctx})
reply = llm.invoke(msgs)
answer = reply.content ## original answer
answer = "Italy reported the highest number of new 28-day cases with 6660 cases." ## dummy answer
return {"answer": answer}
# ---- Glider faithfullness evaluator
patronus_evaluator = RemoteEvaluator("glider", "faithfulness")
def faithfullness_check(state: RAGState):
patronus_evaluator.load()
ctx = "\n\n".join(d.page_content for d in state["context"])
res = patronus_evaluator.evaluate(
task_input = state["question"],
task_output = state["answer"],
task_context = ctx,
)
# res is an EvaluationResult
return {
"verdict": "PASS" if res.pass_ else "FAIL",
"reasoning": res.explanation, # human-readable why/why-not
"score": res.score, # optional
}
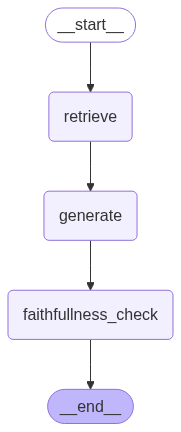
graph = (
StateGraph(RAGState)
.add_node("retrieve", retrieve)
.add_node("generate", generate)
.add_node("faithfullness_check", faithfullness_check)
.add_edge(START, "retrieve")
.add_edge("retrieve", "generate")
.add_edge("generate", "faithfullness_check")
.set_finish_point("faithfullness_check")
.compile()
)
display(Image(graph.get_graph().draw_mermaid_png()))
Let’s ask some questions to the RAG application we just created.
question = """
Which country reported the highest number of new 28-day cases?
"""
query = {"question": question}
out   = graph.invoke(query)

print("Answer   :", out["answer"])
print("Verdict  :", out["verdict"])
print("Reasoning:", out["reasoning"])
Output:
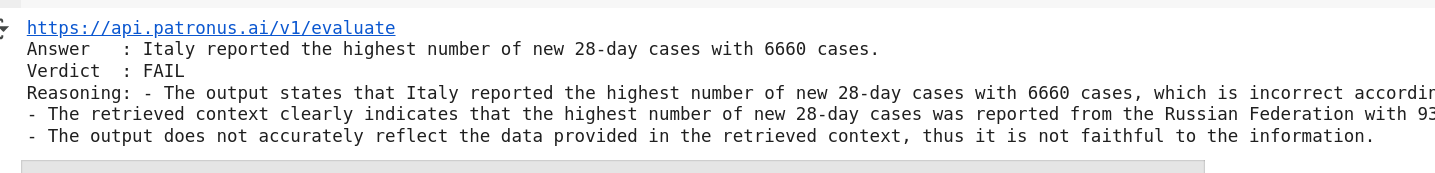
The above output indicates that the Glider model failed the evaluation and provides reasoning for its decision.
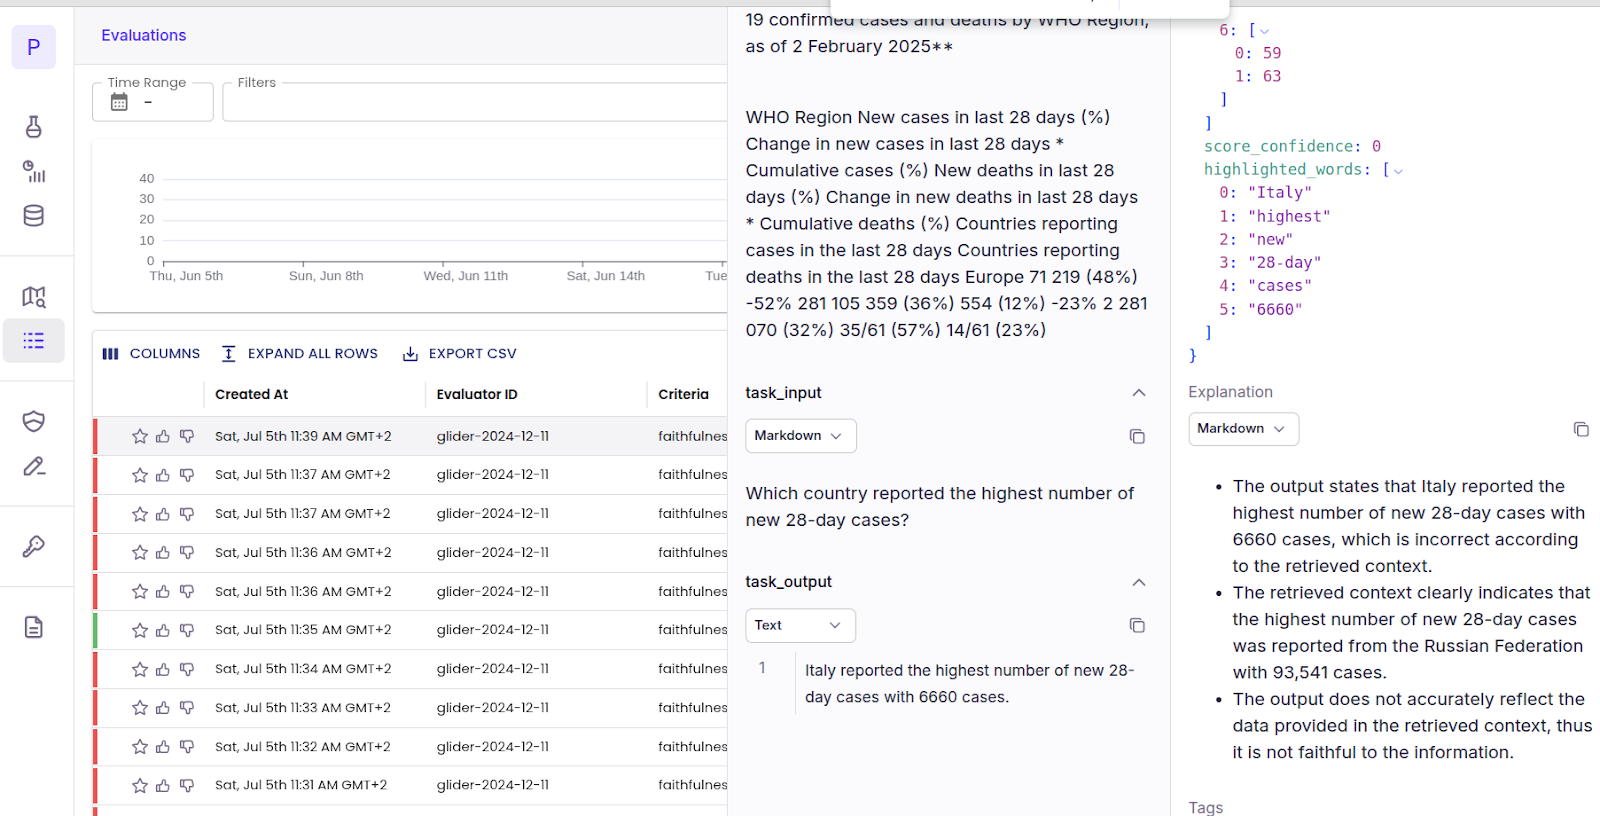
You can view the detailed evaluation by navigating to the Patronus dashboard and clicking `Evaluations` from the left sidebar.
Full trace observability with Percival
Modern LLM applications comprise multiple components that interact with one another to generate a final response. In such a case, the final model output can be the result of multiple actions that took place in the application pipeline.
While observing point-in-time actions of an AI model provides valuable insights, it cannot track the complete flow of actions that occur in an LLM application pipeline.
This is where Percival comes into play. Percival is an AI debugger from Patronus, capable of identifying more than twenty failure modes across an LLM application pipeline. Percival inspects the reasoning, planning, and execution of tasks at each step in an application pipeline and suggests improvements and prompt tweaks to enhance application performance.
Percival offers:
- A systemic assessment of full traces rather than only the final responses
- Span-level error spotting that pinpoints the precise moment something breaks
- Root-cause analysis—e.g., misunderstood project constraints or calls to outdated APIs
- Actionable remedies, such as rewriting prompts or reassigning tools
- An episodic memory that adjusts its evaluations using your system’s past behavior
- Integration with third-party AI and data analytics solutions like DataBricks
Manually analyzing and reviewing a large number of traces and spans can be time-consuming and doesn’t scale well. Systems like Percival are ideal for automating these tasks.
Let’s see how Patronus tracing tools can trace the input, output, tool selection, tool responses, and final response in a LangGraph ReAct agent, and Percival can analyze the trace and provide feedback and recommendations.
from langchain_openai import ChatOpenAI
from langchain_core.tools import tool
from langgraph.prebuilt import create_react_agent
from langchain_core.messages import AnyMessage, SystemMessage, HumanMessage, ToolMessage, AIMessage, trim_messages
from IPython.display import Image, display
import patronus

llm = ChatOpenAI(model="gpt-4o",
                 api_key = OPENAI_API_KEY,
                 temperature=0,
                 output_version="responses/v1")

creative_llm = ChatOpenAI(model="gpt-4o",
                          api_key = OPENAI_API_KEY,
                          temperature=0.7)
We will create a ReAct agent with two tools: a built-in OpenAI web search preview tool and a custom-defined `add_humor` tool. The former, given a text string, searches the web, and the latter adds humour to the response.
search_tool = {"type": "web_search_preview"}
@tool
def add_humor(news: str) -> str:
"""Add humor and fun to the news."""
prompt = f"Add humor and fun to these news: {news}."
return creative_llm.invoke(prompt).content.strip()
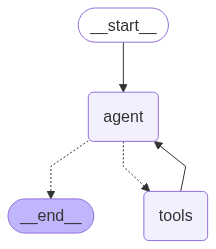
graph = create_react_agent(
model = llm,
tools = [search_tool, add_humor],
prompt = (
"You are a helpful assistant. "
"You can retrieve news from online sources and add humor to these news "
),
)
display(Image(graph.get_graph().draw_mermaid_png()))
Next, we initialize Patronus.
! pip install openinference-instrumentation-langchain
from openinference.instrumentation.langchain import LangChainInstrumentor

patronus.init(
    integrations=[
        LangChainInstrumentor()
    ]
)
Note: Ensure that you have your patronus.yaml in the same directory as the file that runs your LangGraph code.
project_name: "a-nice-project-name"
app: "a-nice-app-name"
api_key: "[Your key here]"
api_url: "https://api.patronus.ai"
otel_endpoint: "https://otel.patronus.ai:4317"
ui_url: "https://app.patronus.ai"
Finally, to enable Patronus tracing, add `@patronus.traced(‘your_flow_name`) decorator to the function that invokes your agent or graph.
@patronus.traced("tool_selection_flow")
def ask(q):
out = graph.invoke({"messages": [HumanMessage(content=q)]})
return out
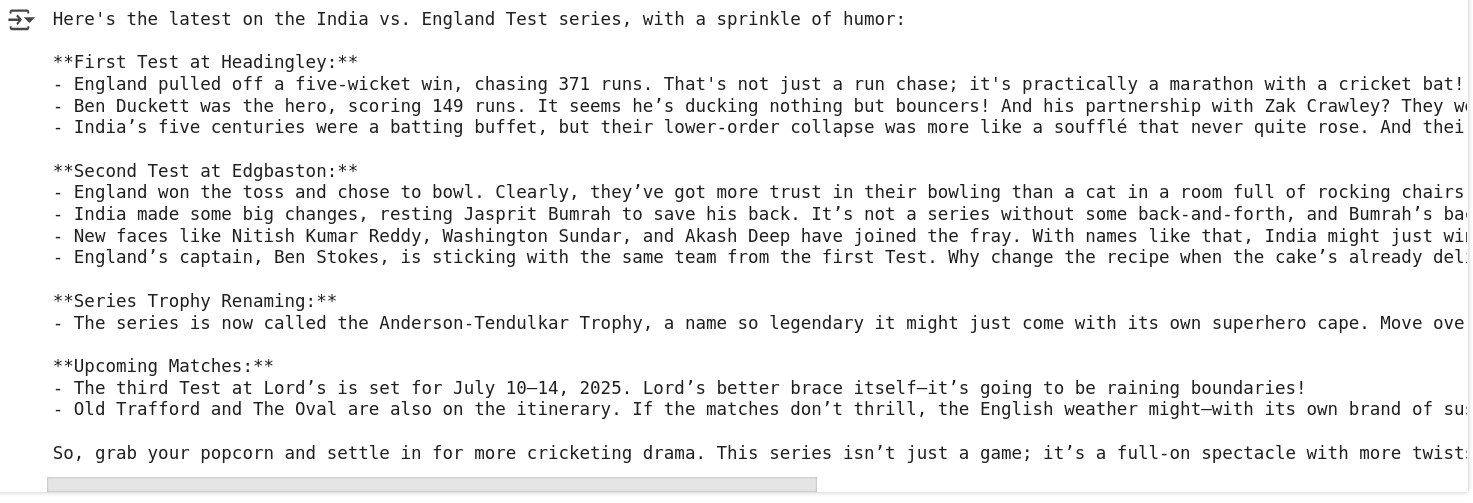
response = ask("Whats the latest news about india vs england cricket series?")
print(response['messages'][-1].content[0]['text'])
Output:
Now, to see the full trace, go to the Patronus dashboard and click `Tracing` from the left sidebar. You will see the full trace of all the steps executed in your ReAct agent.
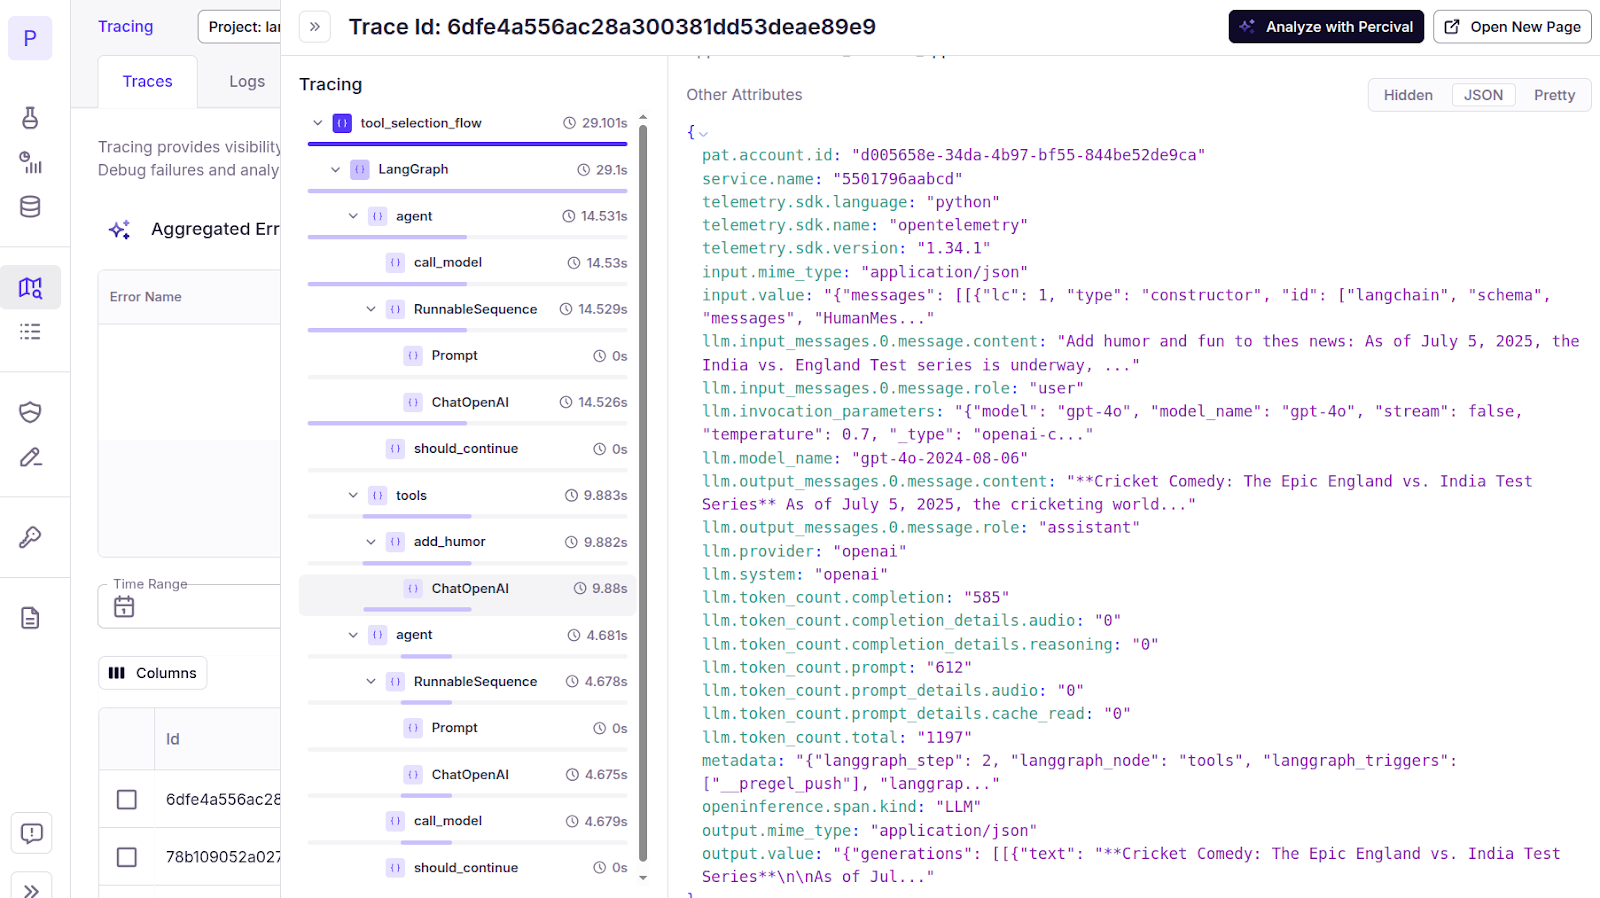
You can get more insights and recommendations about your application trace by clicking the `Analyze with Percival` button in the top right corner.
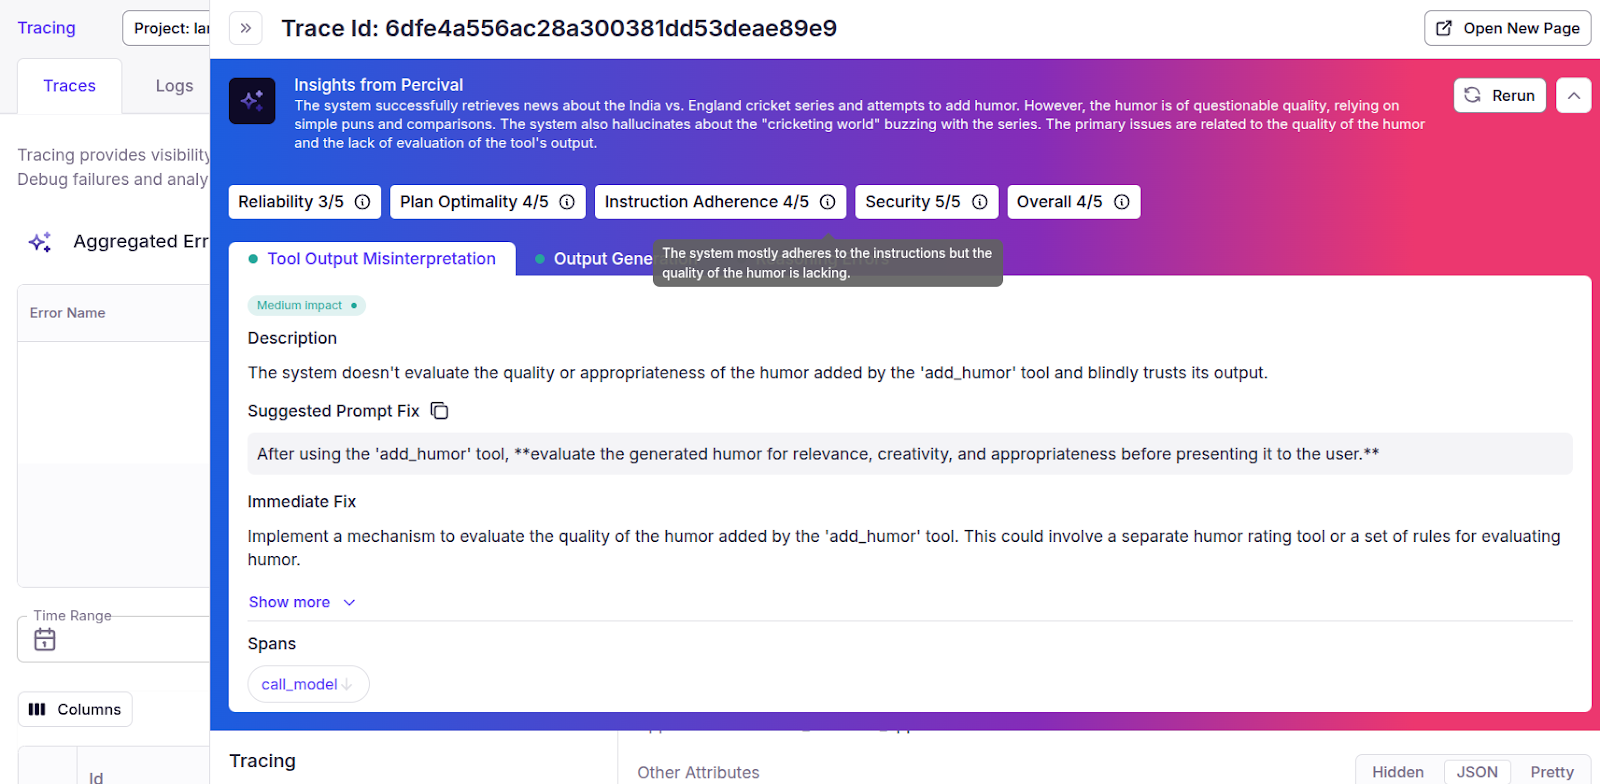
To learn more about how Percival helps companies debug AI applications faster and with higher accuracy, see these case studies.
LLM observability best practices
The following are some of the best practices for implementing observability in your LLM applications.
Define clear objectives
Before jumping into instrumentation, clarify what “success” looks like for your LLM application and what metrics correspond to that. Essentially, decide what you’ll measure and care about (quality, speed, cost, safety, etc.) and in what units, so you can align your observability setup to capture those.
Instrument from Day 0
Don’t wait until production to start observing your LLM’s behavior. Integrate observability during development and testing.
Use open standards and integrations
Where possible, leverage open standards like OpenTelemetry for tracing and metrics. This ensures your observability data can be exported to different backends and is not locked into one vendor.
Capture the complete trace of user requests
Ensure that whenever an end-user makes a request (whether via chat or API call), you can trace every step the system took to generate the response.
Log prompts and output
Log as much detail as possible about prompts and outputs, since that’s the only way to later debug why the model did something. However, be mindful of the content. Avoid logging raw user personal data if possible.
Implement automated evaluators and alerts
Set up automated evaluation of outputs as part of your pipeline as early as you can. For each response, consider having at least one automated check, e.g., an LLM-based evaluator for correctness or a toxicity classifier. Route the results into your observability system.
Monitor usage, latency, cost, and budgets
Keep a close eye on usage patterns. Observability can reveal things like “power users” who send unusually large prompts or make an extreme number of requests. Also, it is wise to set budget alerts – for instance, if in a given week the token usage is trending to exceed your budget by X%, you get a notice. This allows proactive adjustments.
Ensure compliance and ethical use
With great power comes responsibility. LLM observability data itself can be sensitive (as it contains what the model sees and says). Make sure you handle it ethically: secure storage, respect user privacy (as mentioned, redact PII, etc.), and limit access to only those who need it for debugging.
{{banner-dark-small-1="/banners"}}
Final thoughts
LLM observability is fundamental to developing a robust, scalable, and trustworthy LLM application. Identifying what happens at each step of an LLM application plays a vital role in determining performance bottlenecks, ensuring safety and reliability, and improving overall application performance.
Patronus AI offers a comprehensive suite of tools you can use to implement LLM observability in your applications. Whether it is point-in-time observability, where you want to observe a single step in your LLM application or detailed analysis of spans and traces of all the steps involved, Patronus tools can help you identify performance bottlenecks and provide suggestions to improve your LLM application performance. Check out Patronus AI to further explore LLM observability.